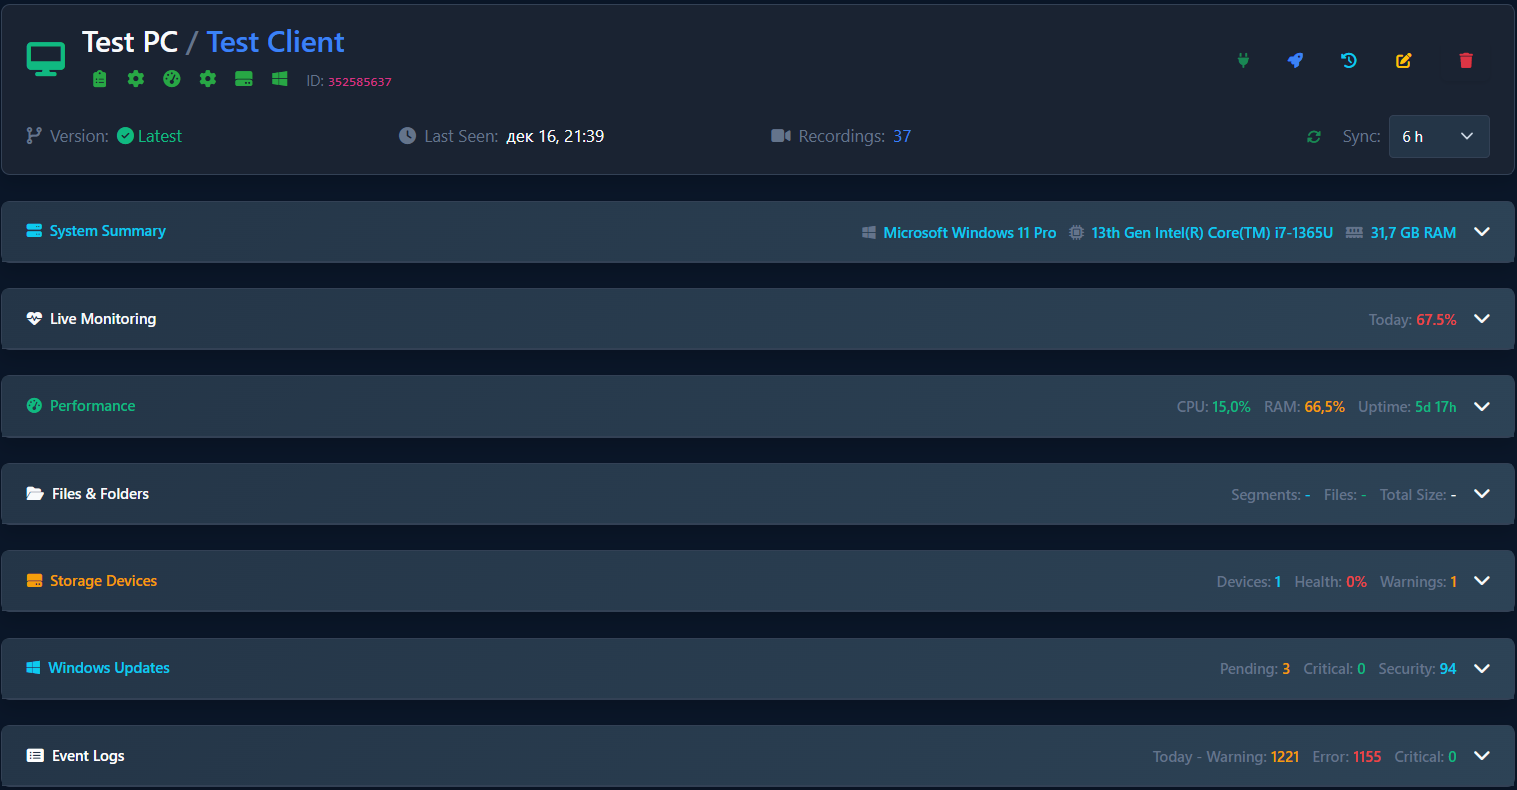
Telmetra Computer Details: read a device in 60 seconds
Struggling with slow endpoints or ambiguous tickets? Telmetra’s Computer Details view gives technicians, MSPs, and IT support teams the ability to diagnose and resolve endpoint issues in under two minutes — without bouncing between tools.
It consolidates device identity, online status, health snapshots, recent activity, and one-click actions into a single pane of insight.
Answer first
The fastest remote support starts with a hypothesis. Computer Details is the “one page” view that helps you decide what to do next without guessing.
Start here for the full remote support workflow:
If you want to convert repeat incidents into monitors:
What Telmetra Computer Details Is For
When you open a computer’s detail view, you should be able to answer:
- 🆔 Identity – Am I looking at the right device?
- 🌐 Reachability – Is it online? Is the data fresh?
- 🚦 Health Snapshot – What’s the most likely bottleneck?
- 🕒 Timeline – What changed before the issue started?
- 🛠️ Next Action – What’s the least disruptive step I can take?
This structured model turns ambiguity into actionable support steps — fast.
What You Can Do in Computer Details
- ✅ Confirm device identity (hostname, site, OS, user)
- 🔍 Check online status and last-seen timestamp
- 📊 Identify likely performance issues: CPU, memory, disk, network
- 📅 Review recent reboots, warnings, or update events
- 🎯 Take action with purpose — remote control, restart, or escalate
No more guessing based on ticket notes. Telmetra gives you evidence.
Identity: Avoid Wrong-Device Mistakes
Always start with confirmation of the endpoint:
- Hostname / device name
- Client or tenant label
- OS and version
- User currently logged in (if shown)
Why? Because rebooting or remoting into the wrong device is a top cause of avoidable incidents — especially in MSP environments.
Reachability: Trust the Data (or Don’t)
Before acting, ask two things:
- Is the device currently online?
- When was it last seen?
If a computer hasn’t checked in recently, treat its health data as historical — not real-time. That awareness can prevent hours of confusion.
Health Snapshot: Find the Bottleneck
When a user says “It’s slow,” you need to answer why.
Telmetra gives real-time metrics on:
- CPU usage – Great for diagnosing lag, freeze, or fan noise
- Memory pressure – Correlates with slow tab switching, crashing apps
- Disk space / IO – Matches reports of stutter, failed saves, slow boots
- Network signal – Explains dropped VoIP, cloud sync failures
🧠 Pro tip: Don’t remote in until you can say, “I expect it’s disk pressure.”
Sessions should validate hypotheses — not create them.
Timeline: Connect "When It Started" to "What Changed"
Correlate reported symptoms with changes on the device:
- Reboots or uptime resets
- Updates or patch events
- Warnings or recurring errors
- Maintenance tasks or policy changes
When timelines align with performance drops, you have a root cause.
Actions: Choose the Least Disruptive Path
Here’s a reliable decision order:
- Review metrics and timeline first
- Remote in only if needed
- Run maintenance or reboot if justified
- Escalate with context: what happened, when, and what you tried
This minimizes user disruption and builds confidence with the client.
2-Minute Triage Workflow (Copy for SOPs)
Use this checklist for every "slow device" or "random disconnect" ticket:
- 🔍 Confirm Identity – Hostname, site, user match the ticket
- 🟢 Check Online Status – Confirm it’s reachable and recent
- ⚙️ Identify the Likely Bottleneck – CPU / RAM / disk / network
- 📅 Check the Timeline – Look for correlating changes
- 🎯 Act or Escalate – Take a focused action or document findings
If you’re not fixing or escalating by minute 2, pause and refocus.
Common Pitfalls to Avoid
- ❌ Acting on stale data (last seen check is key)
- ❌ Assuming spikes = root cause (look for patterns)
- ❌ Starting sessions with no hypothesis
- ❌ Not documenting observations (team repeats your steps)
- ❌ Taking action on the wrong device
A few seconds of extra context prevents hours of rework.
FAQ
Q: What is Computer Details for?
A: It's your triage console for one endpoint — confirm identity, trust the data, pick a bottleneck, and take action.
Q: How does this help with “slow computer” reports?
A: Instead of jumping into a blind session, you use metrics to form a hypothesis — then act quickly and confidently.
Q: Can it replace remote access?
A: No, but it makes your remote sessions more targeted — and in many cases, unnecessary.
Q: What should I always check first?
A: Identity and reachability — they determine whether everything else is actionable.
Q: When should I escalate?
A: When you see persistent bottlenecks or patterns without a fix — and you’ve already gathered supporting context.
Why It Matters
Every time a technician re-diagnoses a device from scratch, time is lost. Telmetra’s Computer Details view creates a consistent, team-wide workflow that:
- Reduces escalations
- Speeds resolution
- Prevents repeat mistakes
- Builds better device memory
✅ Use the 2-Minute Workflow to Close Tickets Faster
Start your next triage session with Telmetra’s Computer Details page and follow the checklist.