Telmetra live monitoring in Computer Details for faster diagnosis
When triaging a remote device, context matters.
Telmetra’s Live Monitoring panel gives technicians instant visibility into an endpoint’s health and behavior — without jumping to external tools or dashboards.
From uptime and disconnections to repeatable on-box checks for services, HTTP endpoints, or running processes, Telmetra consolidates it into one view tied to the machine you're working on.
Answer first
Live Monitoring is where you confirm “what’s happening right now” on a device, and where you add repeatable internal checks (services/processes/HTTP) so you don’t troubleshoot from scratch each time.
Start here for the complete monitoring workflow:
Related: if you’re using internal service monitors, you can also restart services and verify recovery:
What You Can Do Here
- ✅ Track uptime, disconnects, and daily activity
- 🔄 Add Internal Monitors for HTTP, services, or process checks
- 🔎 See real-time status, last check time, and 24-hour success rate
- 🛠️ Enable/disable or re-run health checks directly in the UI
- 🔗 Keep all diagnostics anchored to the correct endpoint
Overall Activity: At-a-Glance Device Responsiveness
The Overall Activity section summarizes what the device has been doing:
- ✅ Is it currently responding?
- 📈 What’s the 30-day uptime trend?
- 🔁 How frequent are disconnects or outages?
- 📊 Today’s activity + per-hour breakdown
This gives techs an instant answer to: “Is this device alive and behaving normally?”
Internal Monitors: Device-Centric Health Checks
Telmetra lets you create per-device health checks — no external agents needed.
Supported Monitor Types:
- 🌐 HTTP – Internal or local endpoints
- 🧱 Windows Service – Monitors specific services (by name)
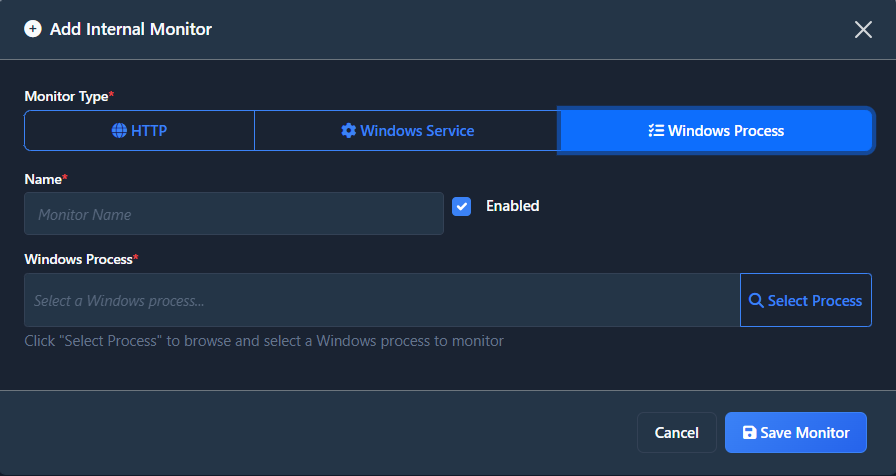
- ⚙️ Windows Process – Detects if a named process is running
These checks run every 60 seconds, log their results, and surface state changes in real time.
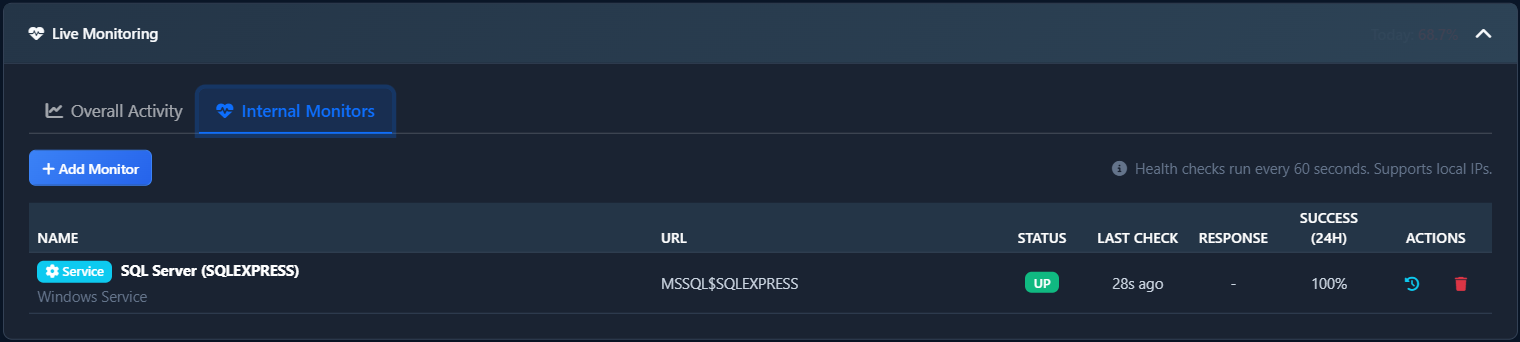
Each monitor row displays:
- 🏷️ Monitor name
- 🎯 Target (service name, endpoint URL, or process)
- 📅 Last check timestamp
- ✅ Current status (pass/fail)
- 📈 24-hour success rate for spotting flapping conditions
Screenshot Examples
📸 Add Monitor Dialog – Configure the check type and target
📸 Monitor Table – See status, last check, and performance at a glance
2-Minute Workflow: Add a Windows Process Monitor
📍 Start at: Computer Details → Live Monitoring → Internal Monitors
- Click Add Monitor
- Set Monitor Type to
Windows Process - Name it descriptively (e.g., “BackupAgent.exe”)
- Leave Enabled checked
- Use Select Process to browse the process list
- Click Save Monitor
- Watch the monitor appear in the list with:
- A populated process field
- A live Last Check timestamp
- A status reflecting current process state
✅ Done — the monitor now checks that process every 60 seconds and reports success/failure.
Common Pitfalls
- ⏱️ Checks update on a 60-second interval — don’t expect instant refresh
- 🔄 Disabled monitors won’t run — check the “Enabled” box if status isn’t updating
- 🧩 Use precise monitor names — ambiguous entries slow down triage
- 🔀 Wrong monitor type — use the right type for each object (e.g., HTTP ≠ Windows Service)
FAQ
Q: What does the 24-hour success rate show?
A: It’s the % of successful health checks in the last 24 hours — useful for spotting intermittent failures.
Q: How often do monitors run?
A: Every 60 seconds.
Q: Where do I add monitors for a specific endpoint?
A: Go to the computer’s Details → Live Monitoring → Internal Monitors, and click Add Monitor.
Q: What monitor types are supported?
A: HTTP, Windows Service, and Windows Process (selectable in the UI).
Q: How do I know a monitor is active?
A: It shows a valid target, an updating Last Check, and a current Status.
Why This Matters
Too often, techs need to remote into machines just to check if a service is running — or worse, miss problems entirely because no one was looking.
Telmetra changes that by embedding simple, powerful checks directly into the machine profile. You gain:
- ✅ Early detection of service/process failure
- ✅ 1-click visibility on uptime and responsiveness
- ✅ Consistent troubleshooting signals across endpoints
✅ Start Monitoring Internals — Without Agents or Guesswork
Telmetra’s Internal Monitors are available on every enrolled endpoint.
Add a monitor today and get eyes on what matters — 24/7.